
New! – Google Colab version of this code is available in this link. No need to install any software to run code. Download these files (training.csv and validation.csv) and upload when Colab requests for it.
Github Repository of Colab Code is available in this link.
For post on Keras Nonlinear Regression – Guass3 function click on this link
_____________________________________________________
This post is about using Keras to do non linear fitting. The simplicity of Keras made it possible to quickly try out some neural network model without deep knowledge of Tensorflow.
The data for fitting was generated using a non linear continuous function. It has five inputs and one output. Both the training set and validation set have around 500 data points.
Y = SIN(A) x EXP(B) + COS(C x C) + POWER(D,5) – TANH(E)
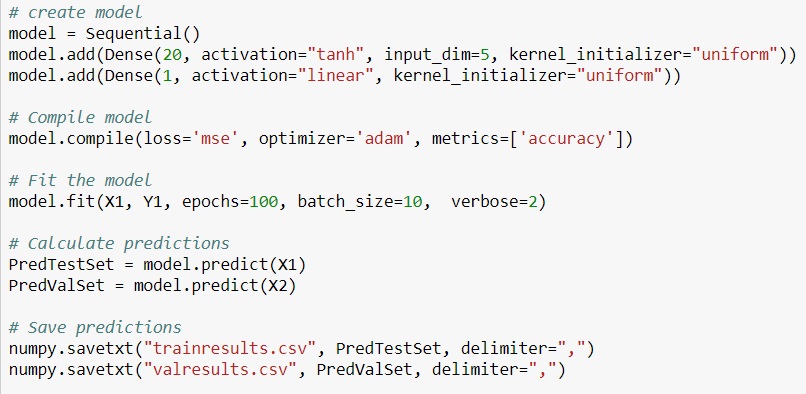
I realized that adding too many hidden layers worsened the fit. Looks like for continuous functions, one hidden layer with sufficient number of nodes and good choice of activation function is sufficient. I chose hyperbolic tangent (tanh) for activation function and adam for optimizer. The results were pretty good but required some good number of iterations.
I plan to compare this with other regression algorithms available in Azure Machine Learning.
Complete code available on Github – https://github.com/shankarananth/Keras-Nonlinear-Regression
[pastacode lang=”python” manual=”from%20keras.models%20import%20Sequential%0Afrom%20keras.layers%20import%20Dense%0Afrom%20sklearn.metrics%20import%20r2_score%0Aimport%20matplotlib.pyplot%20as%20plt%0Aimport%20numpy%0A%25matplotlib%20inline%0A%0A%23Red%20data%20from%20csv%20file%20for%20training%20and%20validation%20data%0ATrainingSet%20%3D%20numpy.genfromtxt(%22training.csv%22%2C%20delimiter%3D%22%2C%22%2C%20skip_header%3DTrue)%0AValidationSet%20%3D%20numpy.genfromtxt(%22validation.csv%22%2C%20delimiter%3D%22%2C%22%2C%20skip_header%3DTrue)%0A%0A%23%20split%20into%20input%20(X)%20and%20output%20(Y)%20variables%0AX1%20%3D%20TrainingSet%5B%3A%2C0%3A5%5D%0AY1%20%3D%20TrainingSet%5B%3A%2C5%5D%0A%0AX2%20%3D%20ValidationSet%5B%3A%2C0%3A5%5D%0AY2%20%3D%20ValidationSet%5B%3A%2C5%5D%0A%0A%23%20create%20model%0Amodel%20%3D%20Sequential()%0Amodel.add(Dense(20%2C%20activation%3D%22tanh%22%2C%20input_dim%3D5%2C%20kernel_initializer%3D%22uniform%22))%0Amodel.add(Dense(1%2C%20activation%3D%22linear%22%2C%20kernel_initializer%3D%22uniform%22))%0A%0A%23%20Compile%20model%0Amodel.compile(loss%3D’mse’%2C%20optimizer%3D’adam’%2C%20metrics%3D%5B’accuracy’%5D)%0A%0A%23%20Fit%20the%20model%0Amodel.fit(X1%2C%20Y1%2C%20epochs%3D100%2C%20batch_size%3D10%2C%20%20verbose%3D2)%0A%0A%23%20Calculate%20predictions%0APredTestSet%20%3D%20model.predict(X1)%0APredValSet%20%3D%20model.predict(X2)%0A%0A%23%20Save%20predictions%0Anumpy.savetxt(%22trainresults.csv%22%2C%20PredTestSet%2C%20delimiter%3D%22%2C%22)%0Anumpy.savetxt(%22valresults.csv%22%2C%20PredValSet%2C%20delimiter%3D%22%2C%22)%0A%0A%23Plot%20actual%20vs%20predition%20for%20training%20set%0ATestResults%20%3D%20numpy.genfromtxt(%22trainresults.csv%22%2C%20delimiter%3D%22%2C%22)%0Aplt.plot(Y1%2CTestResults%2C’ro’)%0Aplt.title(‘Training%20Set’)%0Aplt.xlabel(‘Actual’)%0Aplt.ylabel(‘Predicted’)%0A%0A%23Compute%20R-Square%20value%20for%20training%20set%0ATestR2Value%20%3D%20r2_score(Y1%2CTestResults)%0Aprint(%22Training%20Set%20R-Square%3D%22%2C%20TestR2Value)%0A%0A%23Plot%20actual%20vs%20predition%20for%20validation%20set%0AValResults%20%3D%20numpy.genfromtxt(%22valresults.csv%22%2C%20delimiter%3D%22%2C%22)%0Aplt.plot(Y2%2CValResults%2C’ro’)%0Aplt.title(‘Validation%20Set’)%0Aplt.xlabel(‘Actual’)%0Aplt.ylabel(‘Predicted’)%0A%0A%23Compute%20R-Square%20value%20for%20validation%20set%0AValR2Value%20%3D%20r2_score(Y2%2CValResults)%0Aprint(%22Validation%20Set%20R-Square%3D%22%2CValR2Value)” message=”Python Code” highlight=”” provider=”manual”/]
The results were pretty good


Leave a Reply